
Data explainer · Sources checked 23 September 2026
The same inflation headline can land very differently in two households. One spends heavily on food and public transport; another has a different mix of rent, school costs and other purchases. A national average does not reproduce either budget exactly.
The Kenya National Bureau of Statistics publishes the official Consumer Price Index and inflation releases. Its CPI explorer lets readers look beyond the overall figure to individual categories and price movements. The release archive identifies the month covered by each report.
Separate three questions
What changed since last month? This is the short-term movement between adjacent months.
What changed over a year? A year-on-year comparison uses the corresponding month a year earlier.
How much do things cost now? This is a question about the price level, not just its rate of change. Slower positive inflation means prices are rising more slowly; it does not mean the earlier increases have disappeared.
Make the figures useful
Keep a simple record of your own recurring purchases: the item, quantity, price and date. Compare like with like. A smaller packet at the same shelf price can be easy to miss if the quantity is not recorded.
Then use the official category data to understand the wider pattern without treating your personal basket as a national survey. Neither measure needs to be dismissed for the other to be useful.
On Magharibi Data, the linked inflation series is an annual historical series. It should not be confused with the latest monthly KNBS release or used as a substitute for it.
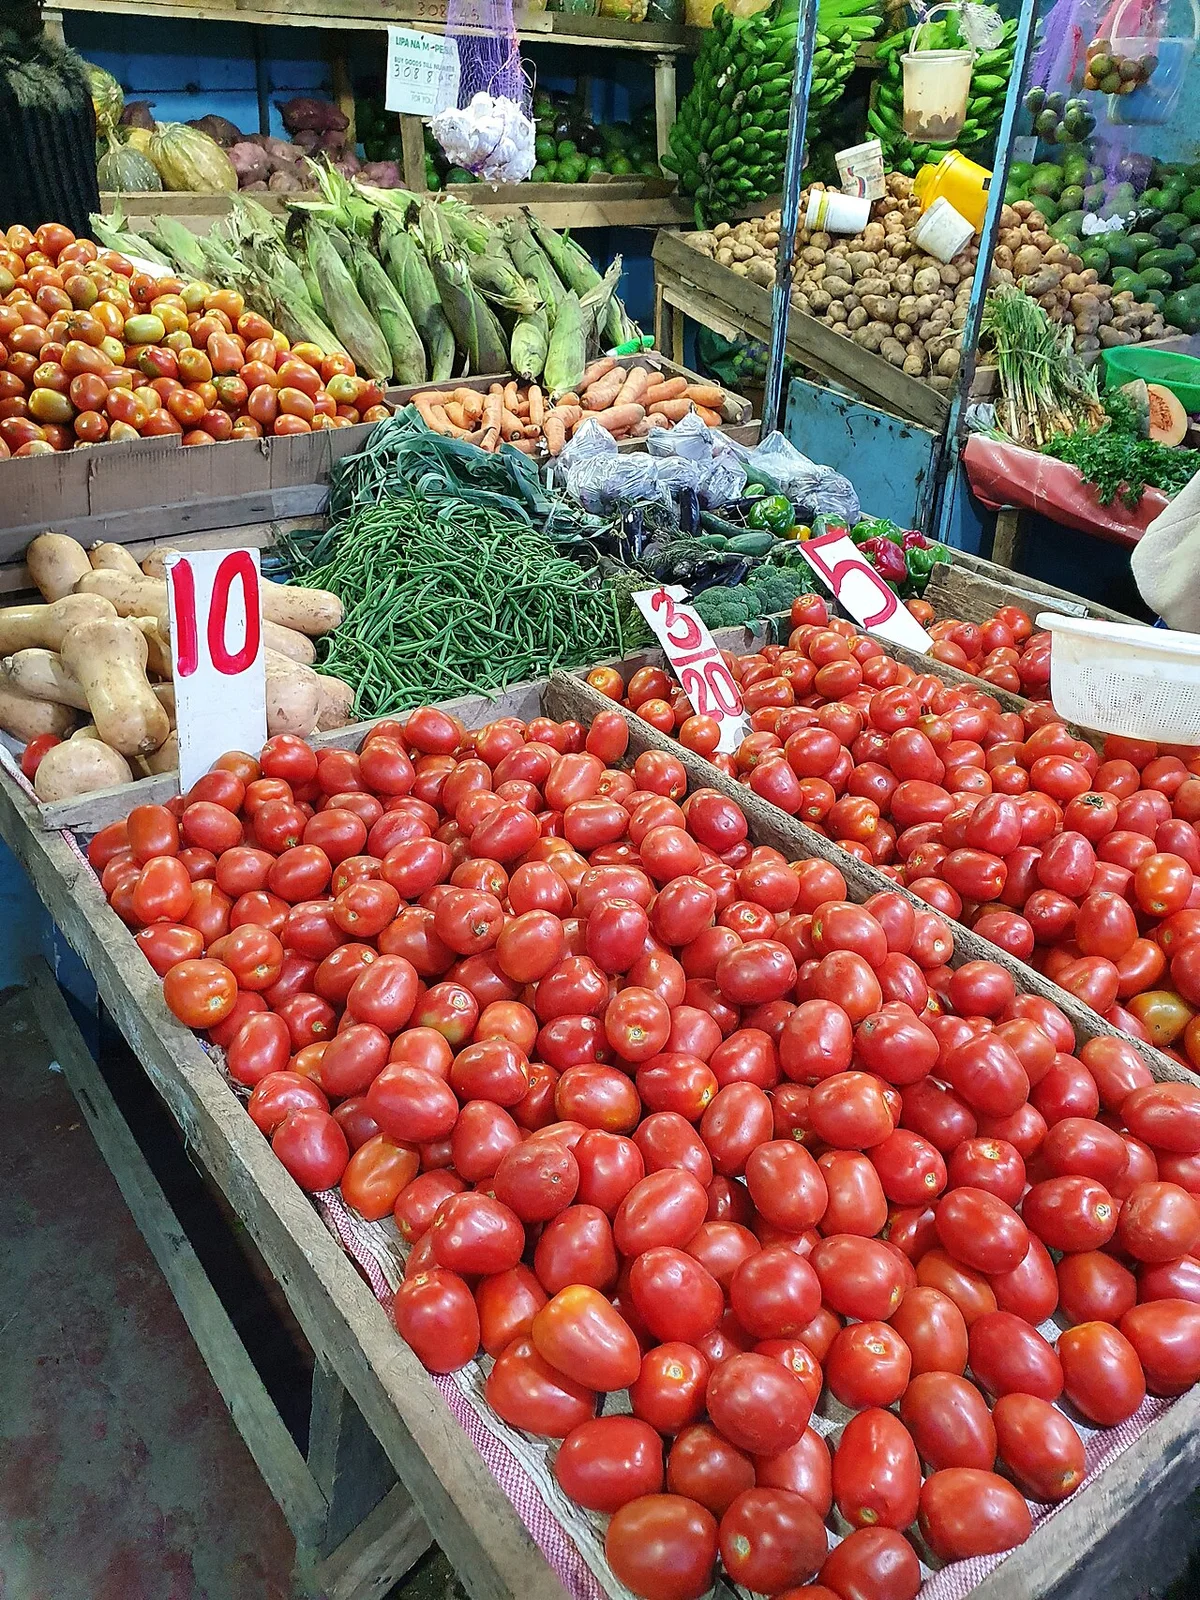
Reporting note: Prepared with AI assistance from the official sources linked in this article. Photo: Terryngari / Wikimedia Commons, CC BY-SA 4.0. Vegetable stall on the outskirts of Nairobi. Context photograph. Resized for display.
